Kolossos has drawn a Feature Density Map with the GeoNames data set. The bright parts of the map show high density areas sporting a lot of features per km² and the dark parts show regions with no or only few GeoNames features.
Dense regions are Bosnia Herzegowina (1.008 features per km²) , Germany (0.447), North Korea (0.318), Pakistan (0.154) and the east coast of the US.
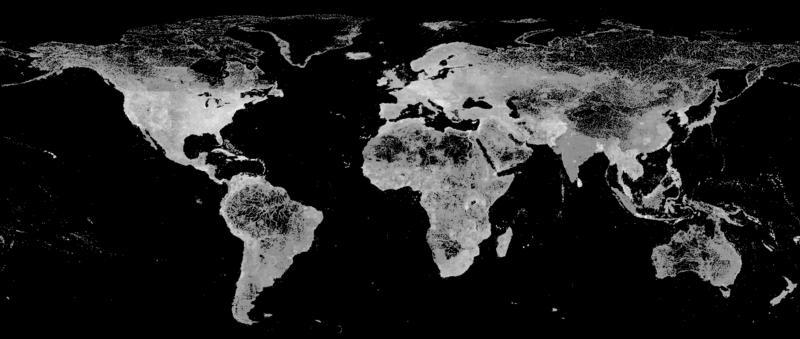
The dark spots mainly indicate unihabited areas and it is thus interesting to compare the Feature Density Map with the Population Density Map compiled by NASA in 1994 :

It shows that India (0.0114) and China (0.0113) have surprisingly few GeoNames features compared to their high population density.
The source code and a large image is available on wikimedia.org.
[more geonames feature statistics]

hi, im from Tres Arroyos, Buenos Aires, Argentina and i liked very much the maps of every cities from the sky. amazing!!! I d like to know if i can have a map from Tres Arroyos to offer on my web http://www.lilleriumpoppinstremens.blogspot.com
best wishes and forgive me for the mistakes. i have not written in english for 5 years
[…] more about it here and here. SCREENS Home Dencity Maps Geominder » Geonotes […]
Hi,
This is my first time visit in this website. I could not believe such a great contribution. I am really encouraged to see the vast datasets that are mapped in the GeoNames. I personally congratulate and thank the people working behind the program. I would also like to contribute by providing more Georeferenced Names of Bangladesh Places in recent future, hopefully which would be shared by the vast user communities in the wider world as well.
With best wishes to all.
Shahed
Thanks Shahed.
Would be great if you could help us with toponyms for Bangladesh. Any contributions are highly welcome.
Best Regards
Marc
Your map is great. Good obsevations as well concerning population density vs Geonames feature density; I think it says alot about technogical level. You will find that if you also compare these two maps with a map of the Vegetation Index, more information begins to emerge. Loosly speaking, the Vegetation Index is the number of days a year that there is something green growing in any given area. The map is in color with VI = Zero showing as black, shading through the color tan to VI = 360 showing as green.
Wow, the density map shows me just how much data has been collected. The RDF exporting Web services of GeoNames are invaluable to heterogeneous tools like the ACRONYM photo annotation tool we’re working on. I will continue to add as much data as possible from Galway and Ireland as a whole and also to add small places like pubs that I encounter when abroad in less familiar territory. Congratulations, keep up the great work and please ensure focus on the Semantic Web aspect!